Visitor survey 2025
Home | Research | Local research |
About the survey
The Tourism team hired Acorn Tourism Consulting to conduct this survey. Their work included in-person interviews, secondary research and social listening.
This survey tells us more about visitors to Thanet. Who are they, what influences them to visit, and where are they coming from? It is also the only research we conduct that enables us to show figures individually for each of the three towns – Margate, Broadstairs and Ramsgate.
This research is based on data collected in June and August 2025. *Terminology used differed between 2018 and 2025 to include experiences.
Age groups
0-15
14%
16-24
7%
25-34
12%
35-44
15%
45-54
12%
55-64
15%

65+
24%
Group composition
Likelihood of recommending
4.55 out of 5
Visiting Markets
All markets
Key UK Markets
South East figures include Kent
Key overseas markets
Trip characteristics
Average length of stay 3.8 nights (Kent holiday trip average: 3.6 nights) Increase in Staying Visitors – up 3% from 2018
Day visitors
Overnight visitors
Day visitors (touring)
Major observations and key changes from 2018
Three quarters of visitors consider sustainability important when choosing to visit a destination.
More people chose to travel by train.
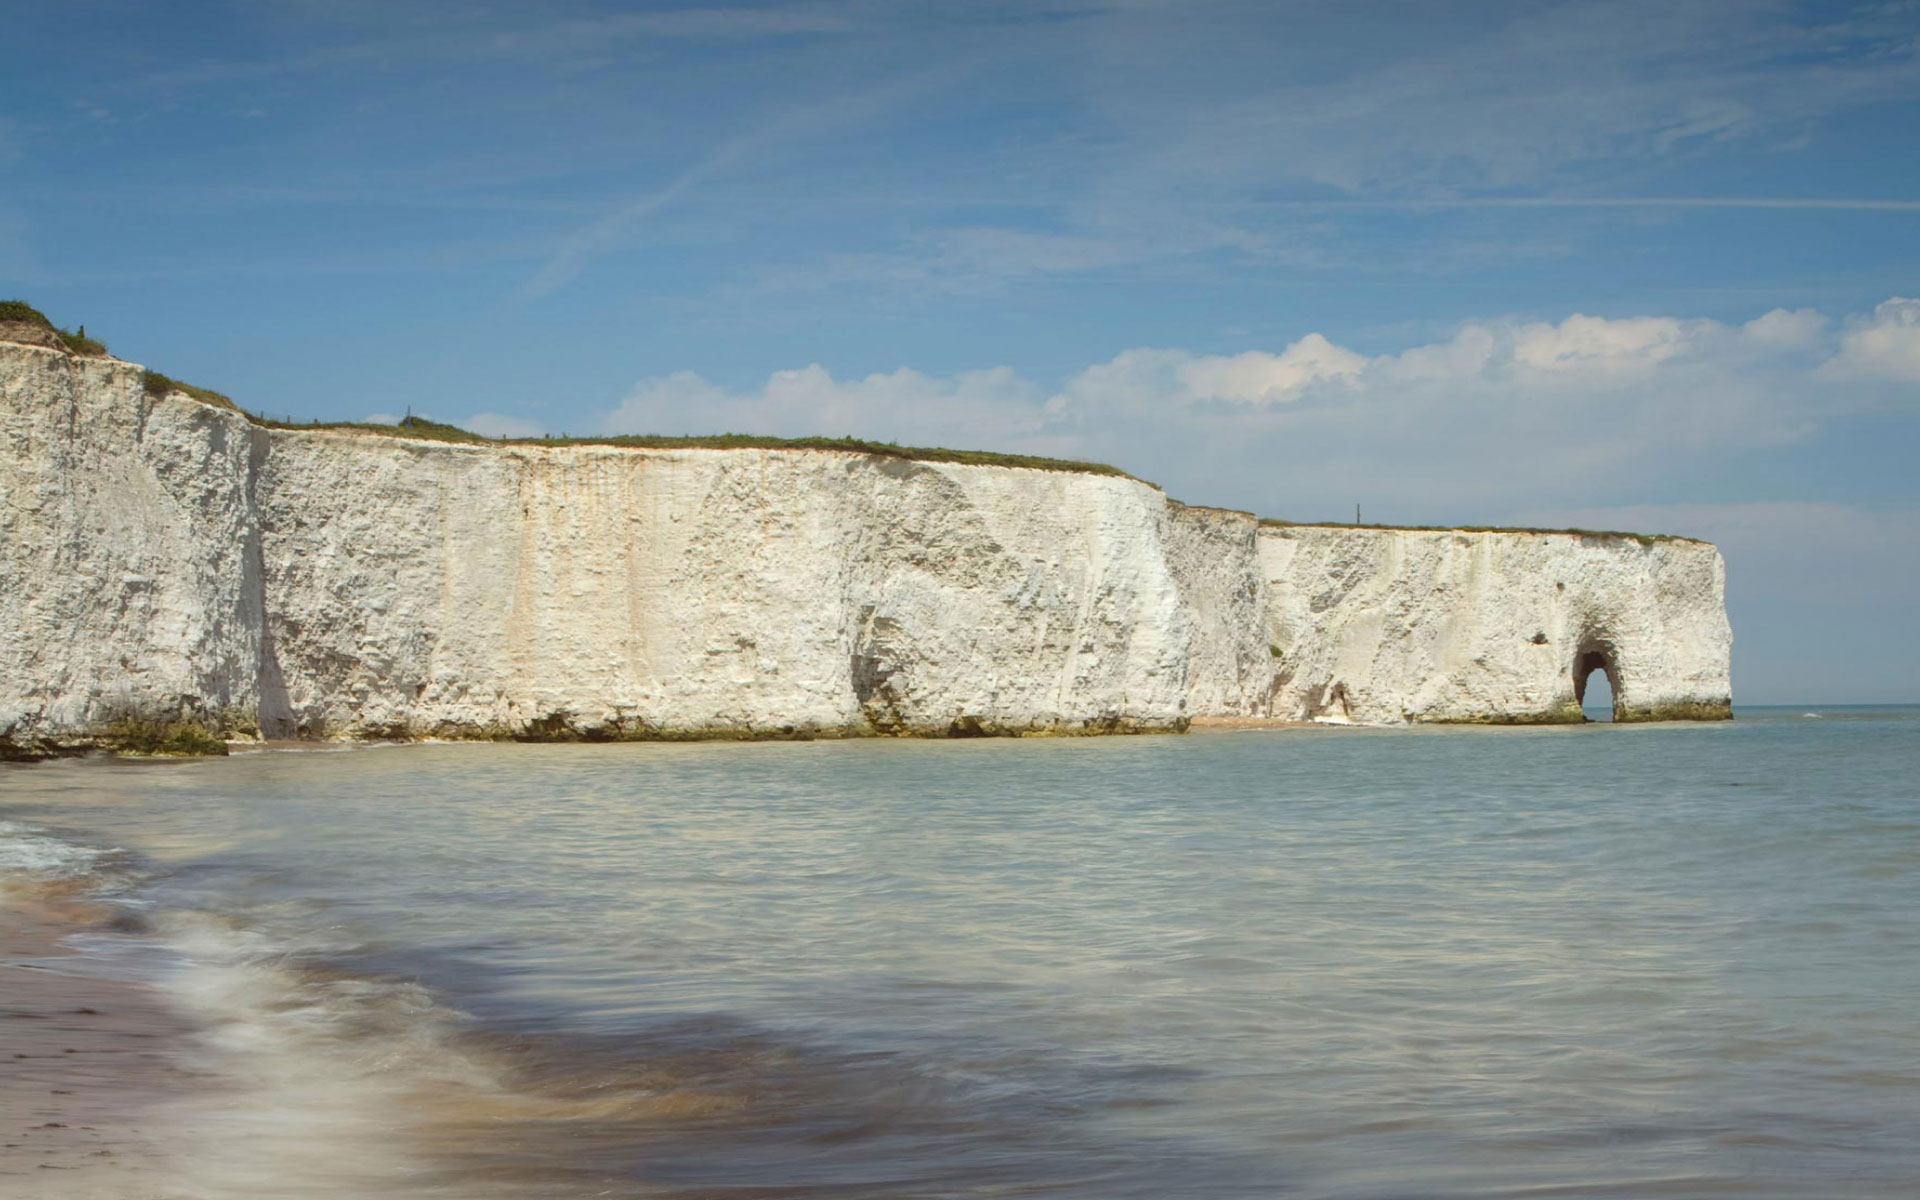
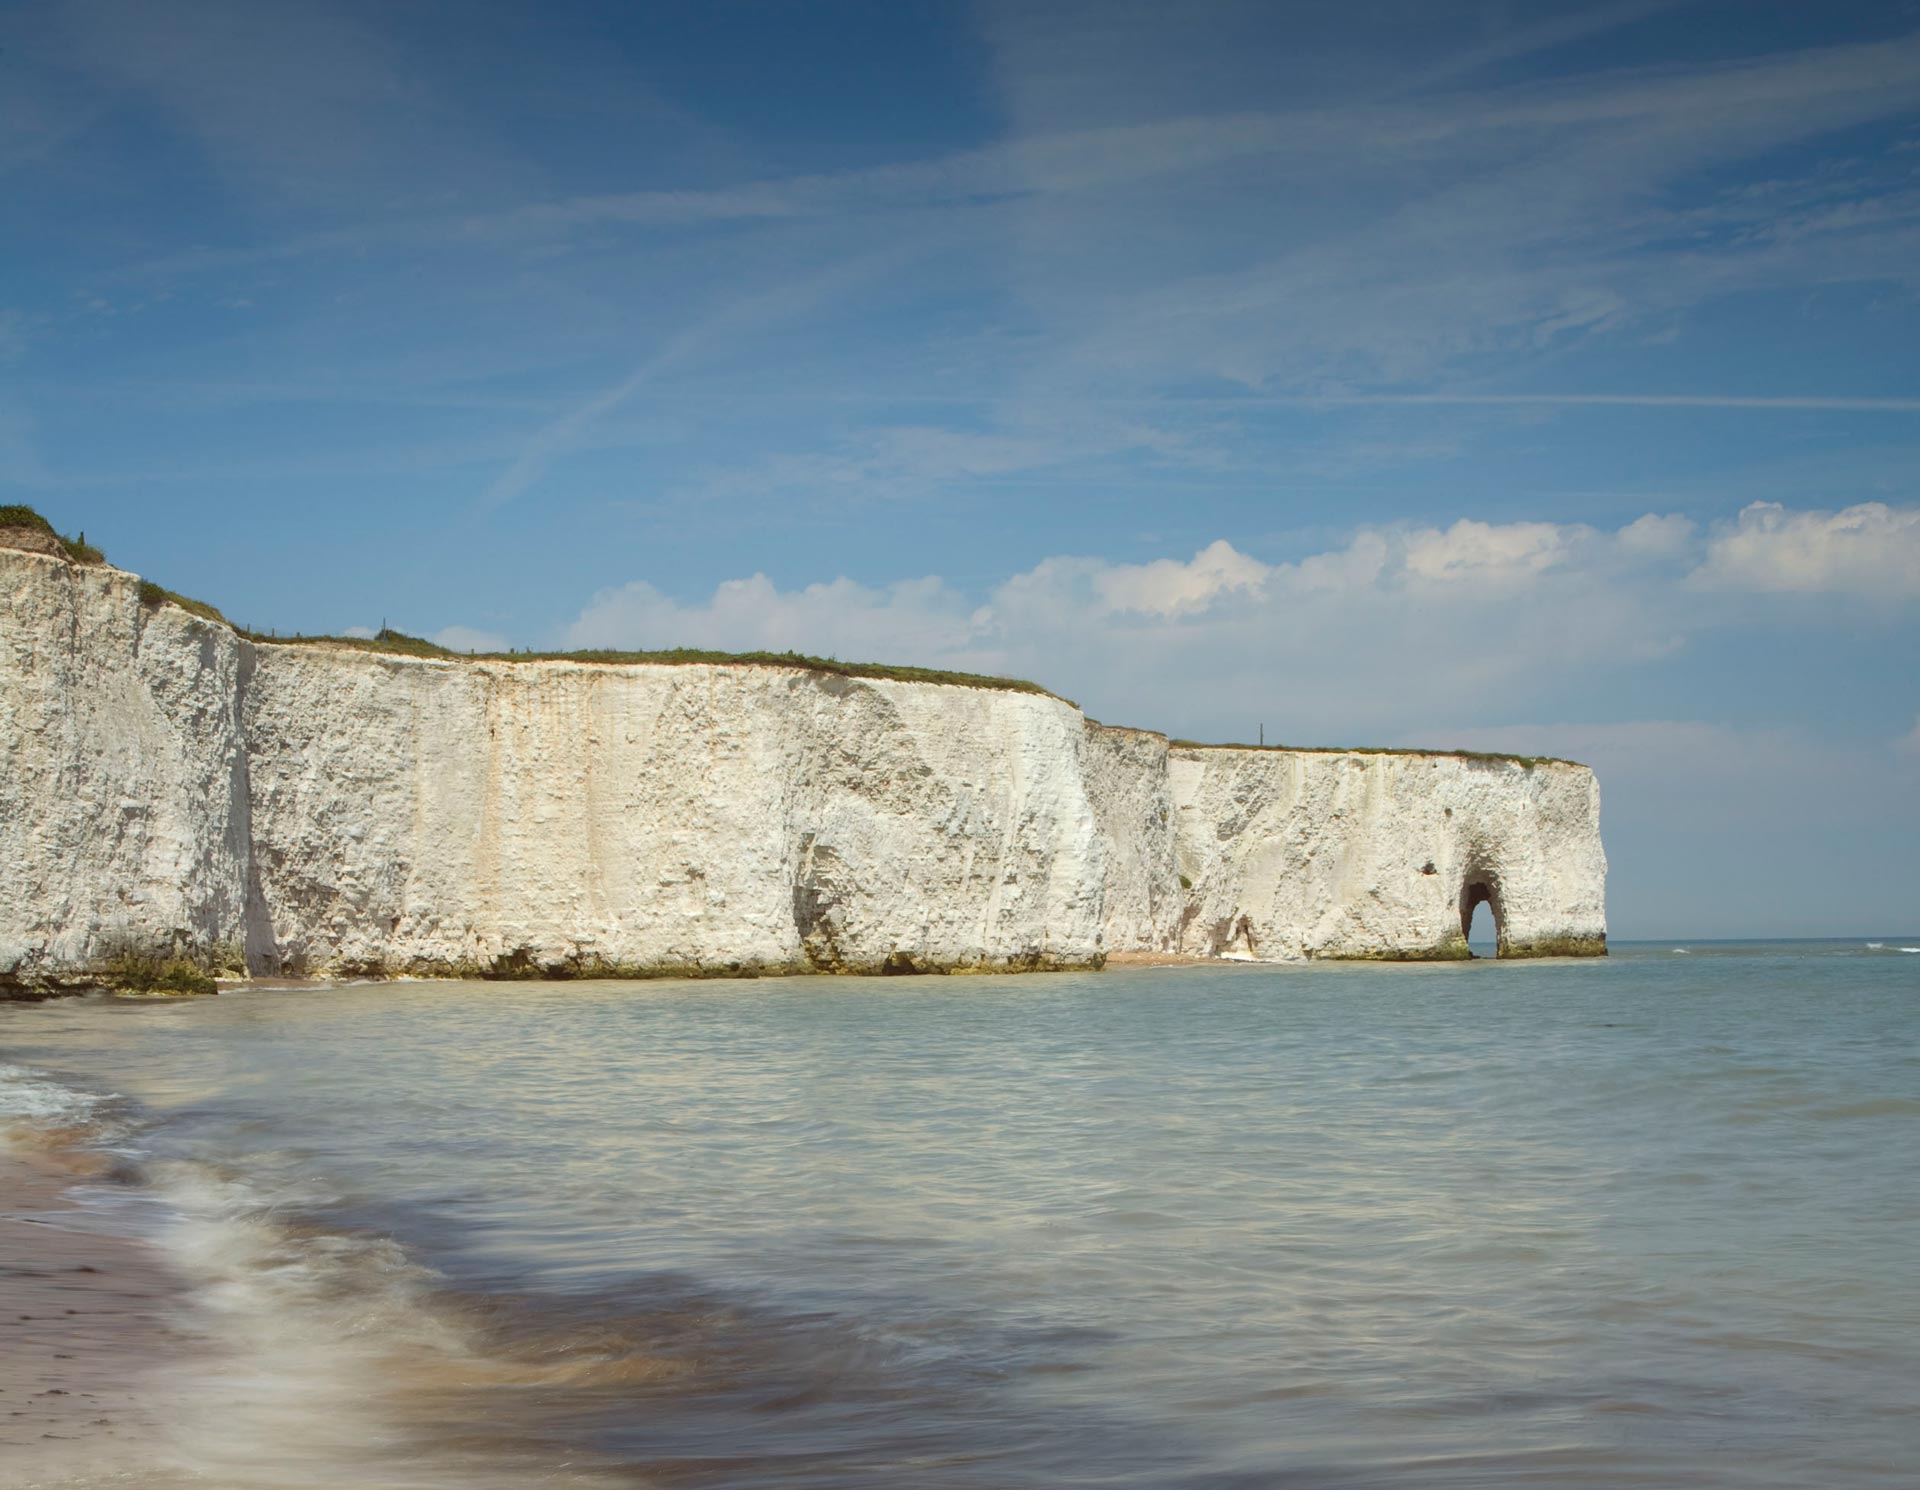
Beaches and the coastline are the key influence for visiting.
Increase in importance of London market.
Increase in AirBnb as accommodation choice.
The growth of social media since 2018 that has brought Thanet’s coastline and beaches to a wider audience.
Accommodation
Hotels
2025: 27%
2018: 26%
Friends / relatives
2025: 24%
2018: 29%
AirBnB
2025: 20%
2018: 9%
Self-catering
2025: 14%
2018: 14%
B&B / Guest house
2025: 9%
2018: 7%
Caravan / camping
2025: 6%
2018: 6%
Key influences
Coastline
Jun/Aug 2025: 80%
Aug/Oct 2018: 53%
Attractions
Jun/Aug 2025: 22%
Aug/Oct 2018: 24%
Arts / culture / music
Jun/Aug 2025: 12%
Aug/Oct 2018: 9%
Food / drink
Jun/Aug 2025: 19%
Aug/Oct 2018: –
History
Jun/Aug 2025: 9%
Aug/Oct 2018: 6%
Outdoor activities & recreational activities
Jun/Aug 2025: 12%
Aug/Oct 2018: 30%
Satisfaction scores (out of 5)
Top 3
4.60
4.60
4.57
Bottom 3
3.64
3.62
3.52
Margate
| Trip characteristics | 2025 | 2018 |
|---|---|---|
| Average length of stay (nights) | 3.3 | 3.6 |
| Day visitor | 56% | 55% |
| Overnight visitor | 31% | 30% |
| Day visitor (touring) | 14% | 15% |
| Method of travel | 2025 | 2018 |
|---|---|---|
| Motor vehicle | 61% | 54% |
| Train | 31% | 30% |
| Coach | 3% | 6% |
| Bus | 3% | 4% |
| Motorhome | 2% | – |
Travel insight
Margate saw the highest numbers of travel by train (31%)
“Quirkiness and hidden secrets, always something new to discover.”
“Friendly atmosphere, lots to do with the family”
Broadstairs
| Trip characteristics | 2025 | 2018 |
|---|---|---|
| Average length of stay (nights) | 4.5 | 5.2 |
| Day visitor | 56% | 55% |
| Overnight visitor | 30% | 26% |
| Day visitor (touring) | 15% | 19% |
| Method of travel | 2025 | 2018 |
|---|---|---|
| Motor vehicle | 56% | 71% |
| Train | 26% | 16% |
| Coach | 13% | 6% |
| Bus | 3% | 3% |
| Motorhome | 2% | – |
Travel insight
Broadstairs saw the highest reduction in car use (15%)
“It's quaint, it's not spoilt, plenty of eats, drinks and walks.”
“Beautiful place, convenient, easy to travel from and to.”
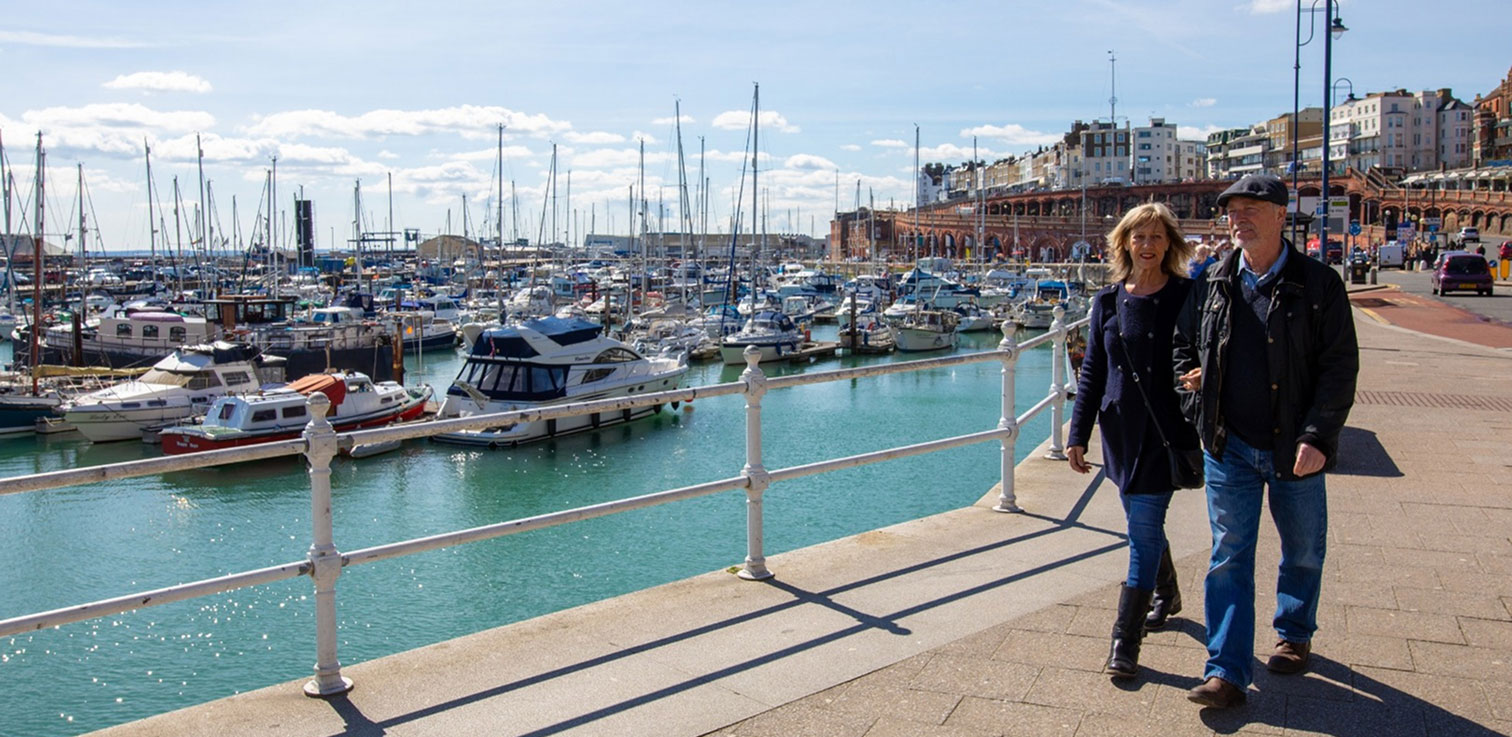
Ramsgate
| Trip characteristics | 2025 | 2018 |
|---|---|---|
| Average length of stay (nights) | 3.5 | 4.5 |
| Day visitor | 59% | 54% |
| Overnight visitor | 30% | 26% |
| Day visitor (touring) | 12% | 20% |
| Method of travel | 2025 | 2018 |
|---|---|---|
| Motor vehicle | 67% | 72% |
| Train | 23% | 12% |
| Coach | 5% | 3% |
| Bus | 4% | 3% |
| Motorhome | 1% | – |
Travel insight
Ramsgate saw the biggest rise in train use (11%)
“The harbour is smart and clean.”
“Flat so it's good for a long walk and the bus service is handy to get back the other way.”
Visitor flow in Thanet
Have you visited or do you plan to visit the following destinations during this trip?
Margate
Broadstairs: 25%
Ramsgate: 21%
Broadstairs
Margate: 20%
Ramsgate: 27%
Ramsgate
Broadstairs: 24%
Margate: 17%
Other Kent destinations for touring visitors
Margate
Canterbury: 13%
Ramsgate: 13%
Broadstairs
Canterbury: 10%
Deal: 10%
Ramsgate
Canterbury: 11%
St Margaret’s Bay: 7%